💃 Demos
1. Parameter and Feature Space
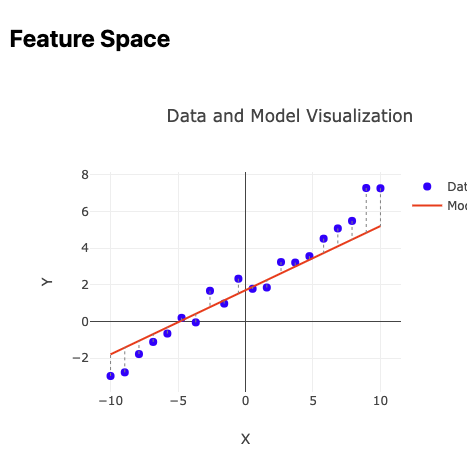
This interactive demo explores the relationship between feature and parameter spaces in regression models. By manipulating model parameters, you can visualize how changes affect both the model fit in feature space and the corresponding position in parameter space, gaining intuition about why squared error creates nicely behaved optimization surfaces with global minima.
2. Linear Regression
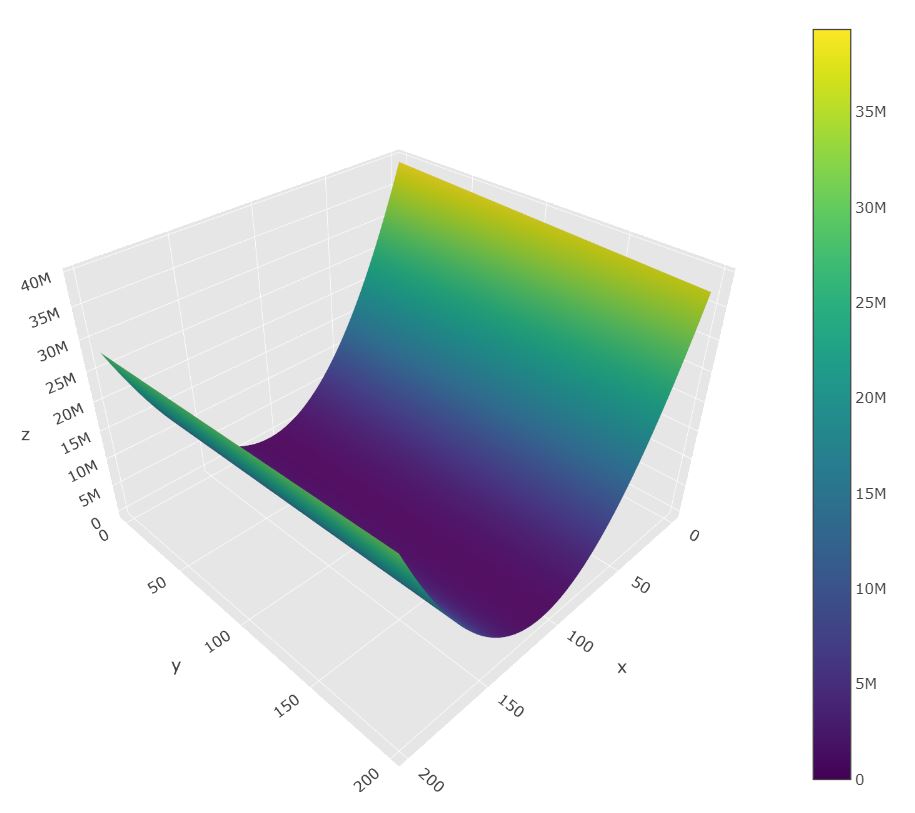
This is a simple demo showing how loss and the function you are trying to learn with linear regression work together. Recently rebuilt in JavaScript, but I first built this in Python within a jupyter notebook. You can download my notebook below to dive deeper!
Supplementary Links:
3. Loss Surface Navigation
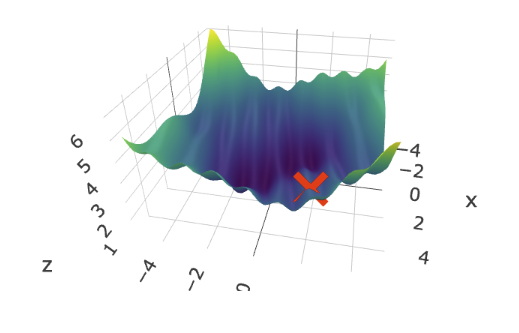
This demo shows how gradient descent moves through various loss surfaces in 3d and 2d contour maps. It also let’s you compare adam to plain gradient descent!
4. Huber Loss
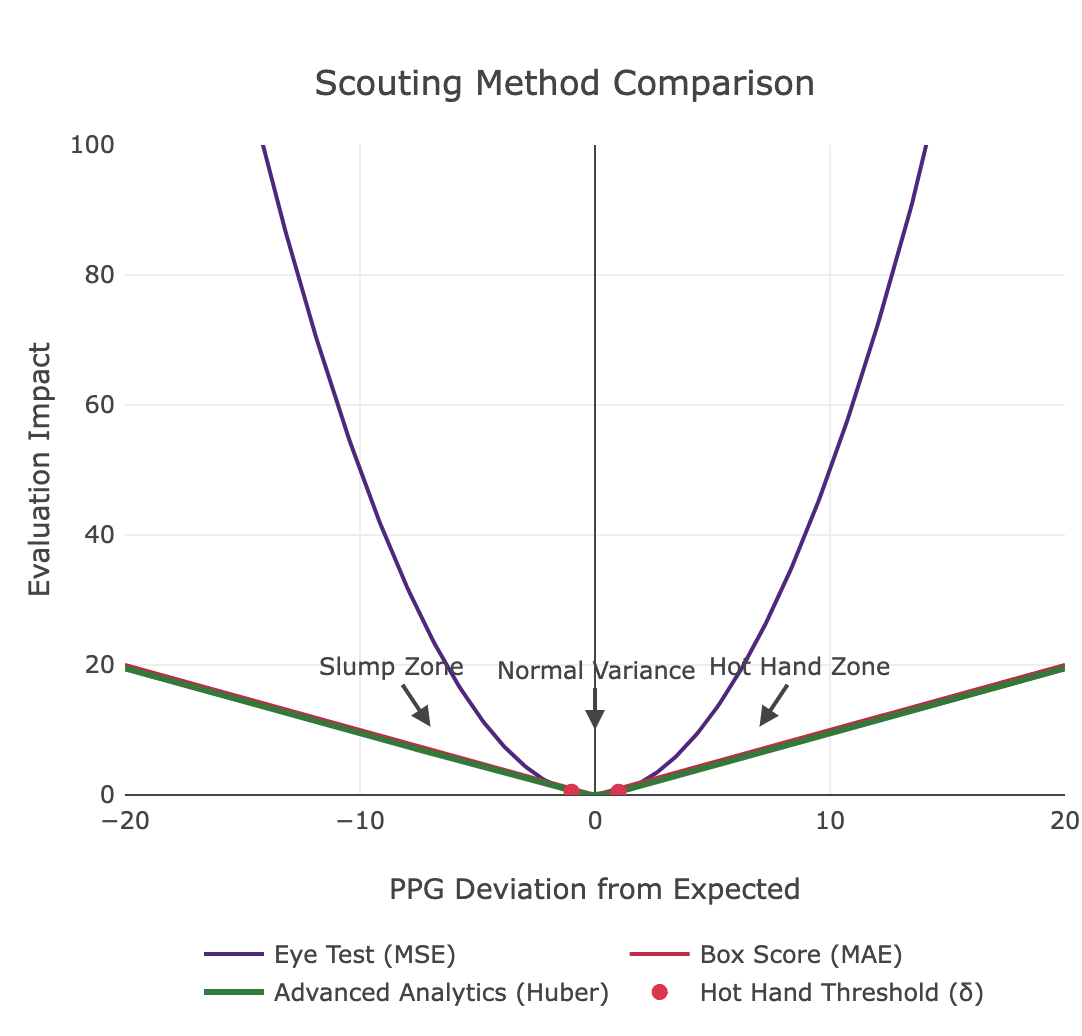
This interactive demo showcases how the Huber loss improves regression robustness in the presence of outliers. By adjusting polynomial degree, noise, and the Huber threshold (δ), users can see how the loss function shifts from squared error for small deviations to absolute error for larger ones. The demo compares traditional least-squares with Huber regression—illustrating model fit, error distributions, and learning curves—to highlight the balance between sensitivity to noise and outlier resistance, ultimately yielding more generalizable models.
5. Interaction Terms
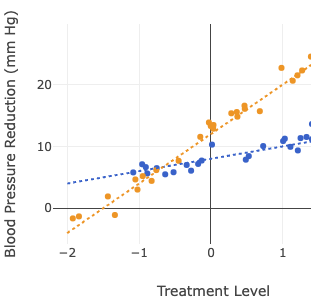
This demo mathematically compares additive versus multiplicative interaction models using a clinical trial dataset as an example, focusing on how design matrices and linear independence impact the model’s identifiability. In the additive case, the interaction term is merely a linear combination of the main effects—resulting in parallel lines—whereas the multiplicative model introduces a linearly independent term that allows for different slopes between groups, yielding unique solutions.
6. Overfitting and Regularization
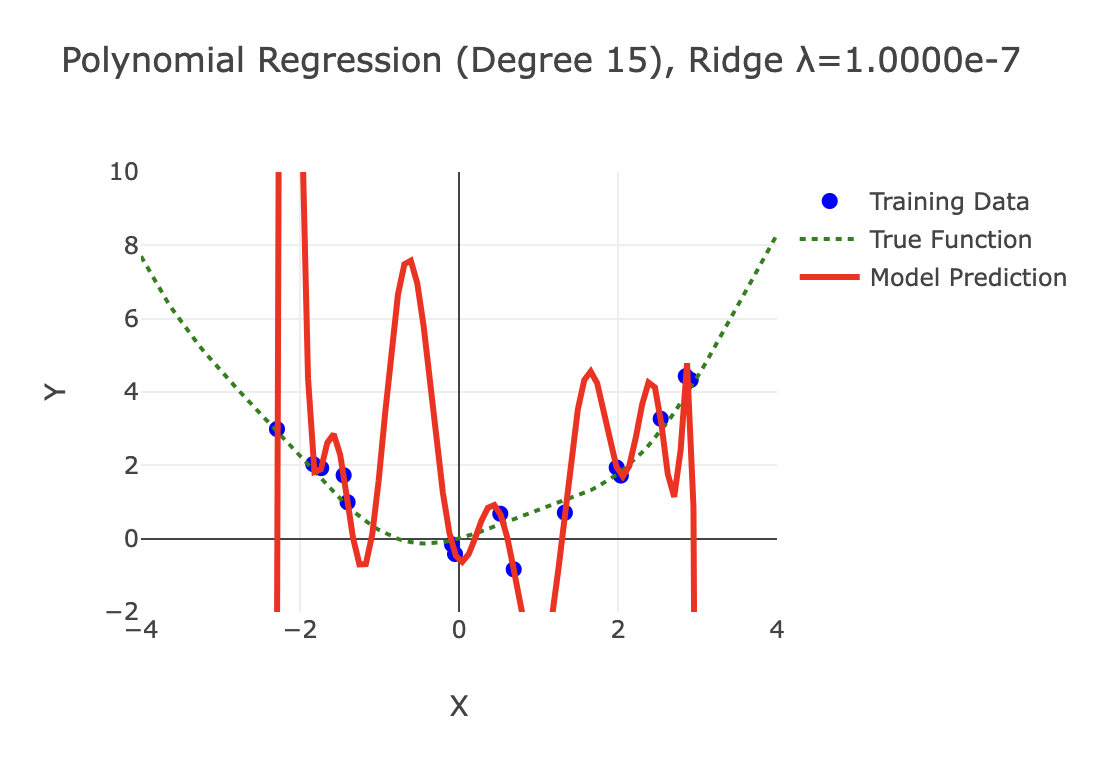
This interactive demo visualizes how regularization techniques control model complexity in polynomial regression. By adjusting polynomial degree, regularization strength (λ), and noise levels, users can observe firsthand how Ridge (L2) and Lasso (L1) regularization prevent overfitting by constraining coefficient magnitudes. The visualization reveals the bias-variance tradeoff through side-by-side comparisons of model fit, coefficient distributions, and learning curves, demonstrating how proper regularization leads to smoother models that generalize better despite sacrificing training accuracy.

7. Multi-Armed Bandit
This interactive multiarmed bandit demo showcases the thrilling challenge of balancing exploration and exploitation as you try your luck on slot machines with hidden success rates. It dynamically updates your winning estimates using Bayesian methods, urging you to strategically alternate between testing new machines and capitalizing on proven performers to maximize your overall reward.

8. K-Means Clustering
This interactive K-means clustering demo illustrates the iterative process of partitioning data points by assigning each to the nearest centroid based on squared Euclidean distance, then updating centroids to minimize the overall Sum of Squared Errors (SSE). It further employs the elbow method to pinpoint the optimal number of clusters by identifying the stage where adding extra clusters yields diminishing improvements in error reduction.